The influence of minerals and lactose content on the stability of whey protein powders
Doina Prodana, Miuța Filipa, Ioana Perhaițaa, Mihaela Vlassaa, Violeta Popescub, Ioan Marcusc, Mărioara Moldovana,*STUDIA UBB CHEMIA, LXII, 4, Tom II, 2017 (p. 397-410)
(RECOMMENDED CITATION)
DOI:10.24193/subbchem.2017.4.34
Abstract
The aim of this paper was to determine the minerals and lactose from a Zonar lactoserum concentrate (L-ZS) obtained by lyophilization as compared to other two commercial powders: a bio whey concentrate (BWP) and a whey protein isolate (IWP), in order to investigate the influence of the mineral and lactose concentration on the protein denaturation temperature. The BCAA content from protein hydrolysates and surface structure of whey powder samples have been also investigated. Lactose content of samples whas: 47.4 g/100g for L-ZS, 46.4 g/100g for BWP, 0 g/100g for WPI. The highest concentrations of minerals Ca, K, Mg, Na and P has been found in BWP, followed by, L-ZS and IWP powders. The fact that L-ZS sample shows a peak temperature (Tp) with 15.82 °C higher than in the case of BWP sample, makes it more resistant to denaturation. The IWP powder has Tp of 87.25 °C, because contains the high quantity proteins that are more resistant to unfolding (denaturation) than the other two samples. Loss of calcium ions leads to partial protein unfolding. The lower mineral content increases the stability of whey protein. A high lactose content leads to the protein aggregation; the functional properties of powder is changes by protein crosslinking. Branched-chain amino acids content in studied samples is in accordance with whey proteins powders type.
a Babeş-Bolyai University, Raluca Ripan Institute for Research in Chemistry, 30 Fântânele street, RO-400294, Cluj-Napoca, Romania
b Technical University of Cluj-Napoca, Faculty of Materials and Environment Engineering 103-105 Muncii Avenue 400641 Cluj-Napoca, Romania
c University of Agricultural Sciences and Veterinary Medicine Cluj-Napoca; Faculty of Veterinary Medicine, 3-5 Mănăștur Street, 400372, Cluj-Napoca, Romania
Introduction
Sweet whey is the liquid left after extraction of casein and milk fat in the cheese making process. This contains a large proportion of milk salts, lactose and water-soluble proteins. The most important whey proteins are alpha-lactalbumin (α-la), beta-lactoglobulin (β-lg), bovine serum albumin, immunoglobulins and protease peptones [1]. The whey composition varies according to the milk composition, the cheese type from which it derives, the heat treatment and other factors. The name of sweet whey protein is due to the fact that it is derived from the production of matured cheeses (like swiss, cheddar, provolon, etc.) and its pH (6.2 - 6.6) is slightly lower than that of fresh milk [2].
The current industrial processes for the production of whey protein concentrates are based on the following processing steps: the whey that containing only about 0.5-0.7 % protein is pasteurized; is concentrated by ultrafiltration (UF) to obtain a fold protein concentration of 20-25; UF retentate being very thick after ultrafiltration is diluted and filtered once more (diafiltration); UF retentate is concentrated by vacuum evaporation; and the UF retentate is concentrate by spray-dried [3].
By the ultrafiltration process is reduced the concentration of lactose and whey minerals. Some of the mineral components can bind to proteins by hydrogen bonding or other attraction forces and can be retained with them. Calcium from whey can prevent or reduce the flow rate of water through the membranes. Techniques such as heating and the pH adjusting of the whey to avoid the problem of water flow rate through the filtration membranes are pre-treatments having an effect by the final mineral content [2].
According to published data [4] “protein denaturation is any modification in secondary, tertiary or quaternary conformation that is not accompanied by the rupture of peptide bonds involved in the primary structure” and “the
terms aggregation refer to unspecified protein-protein interactions that result in the formation of large complexes with higher molecular weights”
[4]. A biomolecule is in equilibrium in solution between native conformation (folded) and its denaturated (unfolded) state. The temperature at which 50% of biomolecules are unfolded is named intermediate transition point
(Tm). Higher Tm corresponds to more stable molecules [5,6]. Transition of proteins from native form to denatured conformation is accompanied by breakage of inter and intramolecular bonds. DSC allows the determination
of the denaturation temperature of the protein [5]. In [7] these transitions explain that the gelation phase of whey globular proteins in heating involves two separate stages. In the first stage there is a partial (denaturation) of
the native global structure involving a breakdown of intramolecular (non-covalent, disulfide) bonds leading to an endothermic process. In the second step an intermolecular aggregation involves the formation of new bonds
between the protein molecules and therefore an exothermic DSC process is expected.
Dairy protein hydrolysates contain bioactive peptides with antiinflammatory properties but also some amino acids. Amino acid profile differs between caseins and whey proteins; caseins contain a large proportion of glutamine and proline residues and minor proportions of arginine, while whey proteins contain branched-chain amino acid (BCAA) residues [8]. BCAAs are so called because of their structure, which includes a side chain of one carbon atom and three hydrogen atoms.
The BCAA are three of the nine essential amino acids respectively leucine (Leu), isoleucine (ILeu) and valine (Val). They are important precursor for muscle protein synthesis [9]. The high level of BCAA and their good digestibility from whey proteins, in particularly Leu, confer those proteins a good nutritional profile for sports nutrition [10]. The proposal of this study is to investigate a powder obtained by lyophilisation of a commercial whey formula (lactoserum namely Zonar) (L-ZS) and to compare it with other two commercial powders, bio whey concentrate (BWP) and whey protein isolate (IWP) in order to corelate influence of the minerals and lactose concentrations upon protein denaturation temperature. The BCAA content from protein hydrolysates and surface structure of studied samples have been investigated.
Results and discussion
At present, there are a large variety of applications of milk whey, especially in medicine and in the food industry, depending on the characteristics of each type of whey. The Zonar lactoserum, produced and distributed by S.C. EmbryOm Capital investment S.R.L., (Satu-Mare, Romania) is obtained from cow's milk and intended to use in curative purposes, at nutritional therapies, or as an adjuvant in the treatment of various diseases such as obesity or type II diabetes [11]. Two commercial powders, from the Romanian market, a bio whey concentrate (distributed by SC Deco Italia SRL, Suceagu, Romania) and a whey protein isolate (distributed by S.C. Way Better Nutrition from Cluj-Napoca) were also investigate.
Quantification of minerals and trace elements in the whey powders
The concentrations of minerals (Ca, K, Mg, Na, P) and trace elements (Cu, Fe, Pb, Zn) in studied whey powders are shown in Figure 1 and 2.
In Figure 1 it can be observed high concentrations of Ca, K, Mg, Na and P in BWP sample compared with L-ZS and IWP samples.
The natrium concentration, of 0.45 mg / kg in L-ZS sample is lower by compared with 570 mg / kg in BWP sample and 166.91 mg / kg in IWP sample. The calcium concentration is 3134 mg / kg in L-ZS sample while in BWP sample is 4220 mg / kg and in IWP sample is the lowest 2376 mg / kg. The high content of calcium in the BWP sample is an important reason for a lower stability of the protein compared to the L-ZS sample due to hydrophobic interactions that favoring the formation of a very little hydrated gel. [12]. The potassium concentration in L-ZS sample is 7880 mg / kg, but the largest amount was found in BWP sample of 10340 mg / kg, while in IWP sample is the 1380 mg / kg. The magnesium concentrations are 799 mg / kg in L-ZS sample, 1060 mg / kg in BWP sample and 594 mg / kg in IWP sample. Phosphorus is an essential component in many biological molecules, proteins, carbohydrates and nucleic acids. Phosphor concentration found in L-ZS sample is 4900 mg / kg comparative with 5440 mg / kg in BWP sample and 1770 mg / kg in IWP sample.
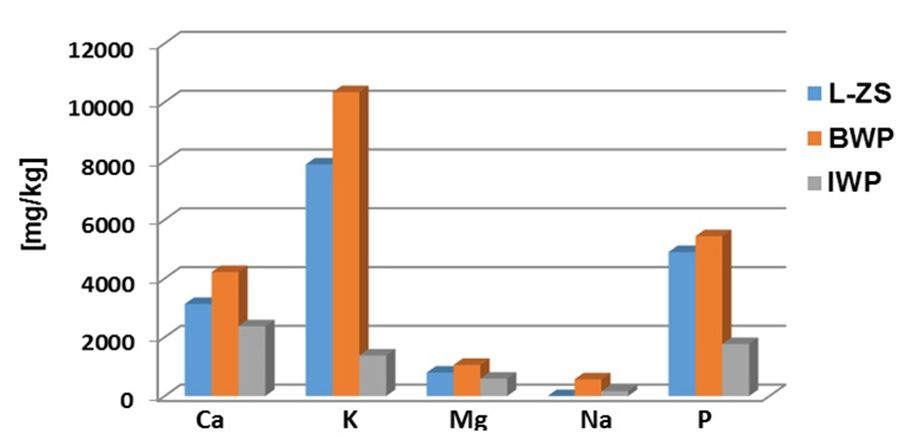
Fig. 1 The minerals distribution in the studied whey powders (L-ZS is Zonar lactoserum concentrate, BWP is bio whey concentrate, IWP is whey protein isolate)
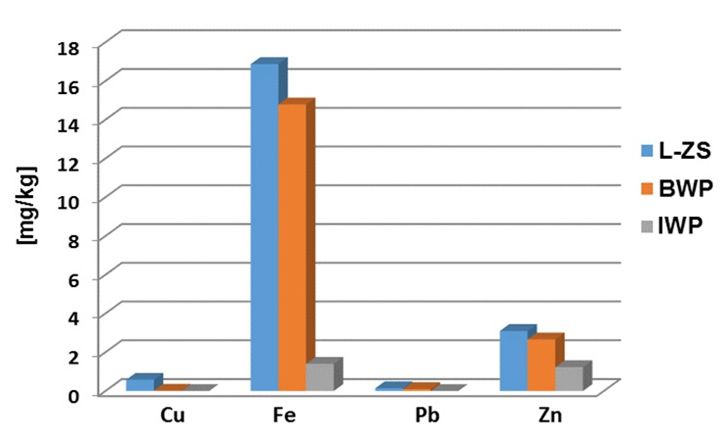
Fig. 2 Distribution of the trace elements in the studied whey powders
The Figure 2 shows that the L-ZS sample contains the highest iron concentration, of 16.87 mg / kg, while the BWP sample contains of 14.79 mg/ kg and the IWP sample contains of 1.405 mg / kg.
In the immune system the zinc have a lot of functions like produce energy, to synthesize proteins, to stabilize membranes against bacterial endotoxins, to produce antioxidant enzymes and to produce antibodies [13]. The L-ZS sample also contains a higher concentration of zinc of 3.1 mg / kg while the BWP sample contains 2.66 mg / kg and IWP sample contains 1.23mg / kg. Concerning the cooper and lead concentrations, these are below 1mg / kg in all investigated samples.
The concentrations of the investigated elements may varies, depending on the milk type (from cow or goat), the animals feeding, the whey obtaining method and not the least, the analysis method used for whey caracterisation [14].
Determination of lactose in the whey powders by HPLC
Lactose affects the whey protein powders stability, protecting the proteins against thermal denaturation during drying. If the lactose content of the powder is lower, then the amount of denatured protein is greater. Lactose from the studied powders affects the aggregation of thermally denatured proteins as well as the characteristics of these aggregates; Also it has the ability to replace the water molecules in hydrophobic areas and to prevent complete unfolding of protein [15].
Determination of lactose in the whey powders was perform by high performance liquid chromatography with reflectance index detector (HPLC-RI). Figure 3 shows the chromatograms of lactose standard and studied samples.
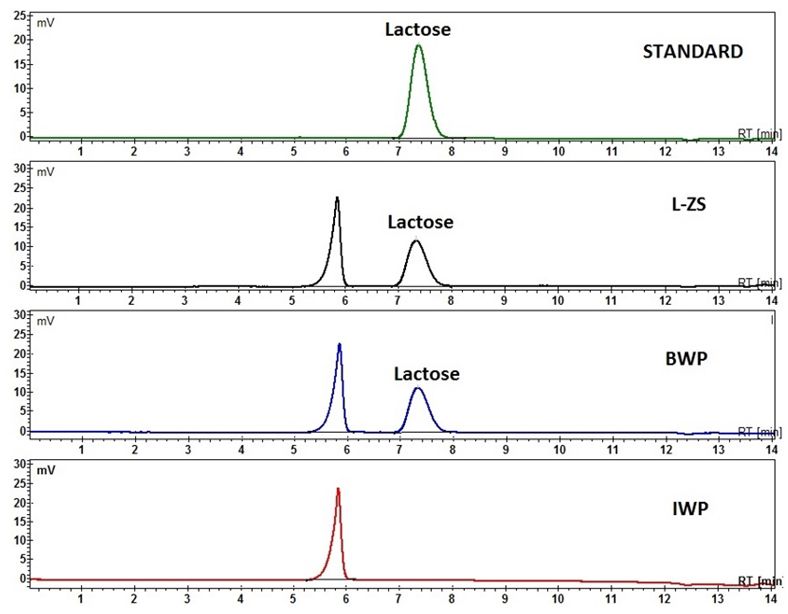
Fig. 3 HPLC-RI chromatograms of lactose standard (RT = 7.24 min) and Zonar lactoserum concentrate (L-ZS), whey bio concentrate (BWP) and whey protein isolate (IWP) samples.
The lactose concentrations in studied samples are: L-ZS sample contain 47.4 g lactose / 100 g powder and BWP sample contain 46.4 g lactose/100g powder. The IWP sample do not contains the lactose because this is a powder of isolate in proteins and not a concentrate in proteins.
Because the lactose contain in the L-ZS sample is highest, this sample is more stable at unfolding of proteins, than BWP sample.
Determination of branched-chain amino acids in whey protein hydrolysates by OPLC
Proteins are macromolecules made up of amino acid chains. To be absorbing in the body, these protein chains it break by means of enzymes. Determination of branched-chain amino acids (BCAA) in whey protein hydrolysates was performed by Overpressured Layer Chromatography (OPLC) technique. The prepared solutions of whey protein hydrolysates where submitted to the OPLC chromatographic separation for determination of BCAA according to previously reported procedure [16].
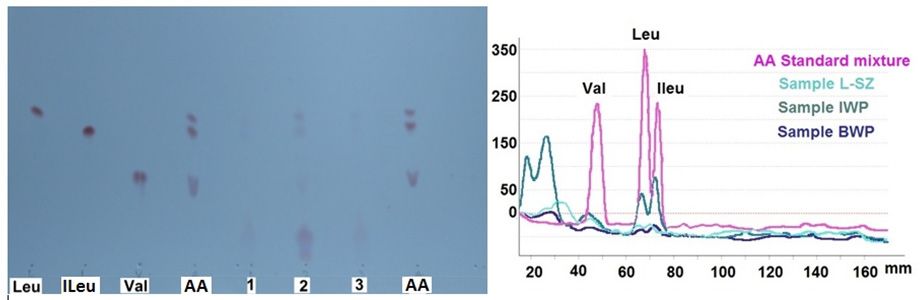
Fig. 4 OPLC Chromatoplate and overlay densitograms of the studied samples. Leu, ILeu, Val are individual standards (1 mg ml-1 each,); AA is amino acids standards mixture (0.333 mg ml-1); samples: 1 (L-SZ); 2 (IWP); 3 (BWP).
The obtained results are presented In Table 1.
| Sample | Val [g/100g] |
ILeu [g/100g] |
Leu [g/100g] |
Total BCAA [g/100g] |
|---|---|---|---|---|
| L-SZ | 1.36 | 0.536 | 1.28 | 3.176 |
| IWP | 6.26 | 6.407 | 16.27 | 28.937 |
| BWP | 0.233 | 0.401 | 1.69 | 2.324 |
Table 1. The content of whey protein hydrolysates samples in BCAAs
The OPLC analysis of the BCAAs in hydrolysates samples (whey concentrates, L-SZ and BWP) show that the L-SZ sample contains a larger quantity of BCAAs total than the BWP sample. Regarding the IWP sample, this contains the higher quantity of BCAAs total is due to that the whey protein isolate is a isolate in whey protein, so it contains more proteins.
Whey powders surface structure investigation by SEM
The surface structure investigation of studied powders was performed by Scanning Electron Microscopy (SEM) using a magnification of 1000. In Figure 5 are shown the structure of studied powders: L-SZ, BWP and IWP.
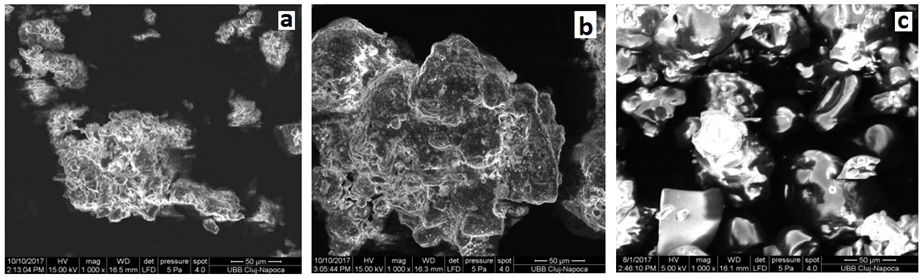
Fig. 5 The SEM micrographs with 1000 magnification of: a) Zonar lactoserum concentrate (L-ZS), b) bio whey protein concentrate (BWP) and c) whey protein isolate (IWP).
From the micrographs a) and b) one can observe a similar structure of the surfaces of the two powders, with agglomerations of particles of different shapes. In the case of microscopy c) crystalline agglomerations with glowing particles of round or irregular shape, characteristic image for the whey protein isolate are observed.
Concerning the powder obtained by lyophilization, the powder surface it should be porous due to the removal of the ice during the lyophilization process, but this was not observed in the case of the L-SZ powder Figure 6 a). At a larger magnification, at x 5000 (Figure 6), in the case of L-ZS, and BWP samples, a wrinkled structure of the sample surfaces with particles of 1-10 μm, more or less rounded, is observed. These are characteristic micrographs of powders with lactose, as whey protein concentrates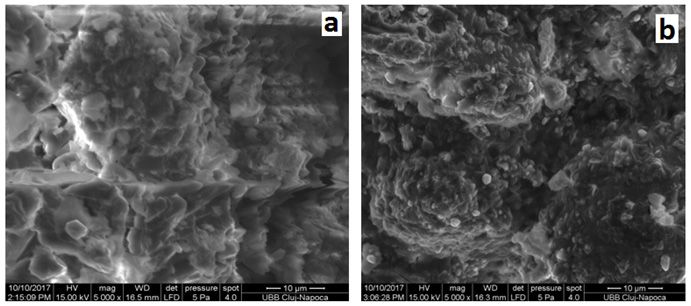
Fig. 6 a) Zonar lactoserum concentrate (L-ZS), b) bio whey protein concentrate (BWP)
In conclusion, from, a clear difference can be observed (Figures 5 and 6) between the lactose free sample surface (IWP) and the samples surface with lactose content (L-ZS) and (BWP) respectively
Protein denaturation of whey powders by DSC
In differential scanning calorimetry (DSC), one or more peaks or inflection points may occur that reflect heat-induced transitions. Depending on the transition that takes place with heat absorption (endotherm) or with heat release (exotherm), the direction of the peak recorded on the thermograms differs. While solids melting and protein denaturation are endothermic processes, the crystallization of carbohydrates and the aggregation of proteins are manifested as exothermic processes [17].
In Figure 7 can see the protein denaturated temperatures of the investigated samples: L-ZS, BWP and IWP.
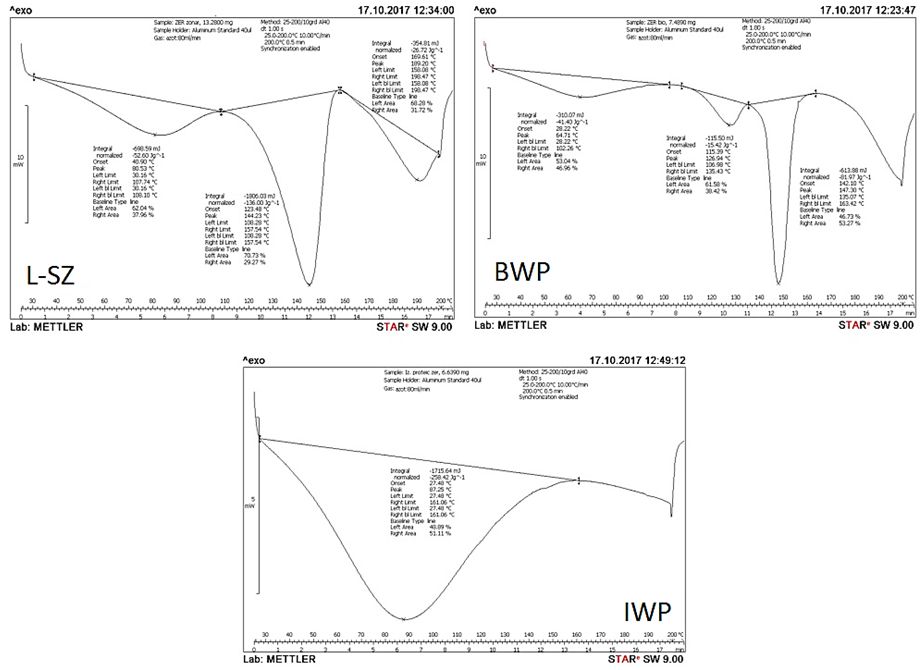
Fig. 7 DSC analyses of: L-ZS - Zonar lactoserum concentrate, BWP - bio whey protein concentrate and IWP - whey protein isolate.
In this study, it is noted that and in other previous studies on the thermal gelation of whey protein, carried out on conventional scanning systems (typical sample mass ~ 15-50 mg), appears only endothermic transitions [7].
In Figure 7 has been observed that L-ZS sample and BWP sample have transition endotherms at the temperatures of 80.53 °C and 64.71 °C, respectively, representing the unfolded of the two major whey proteins α-lg and β-lg. The fact that L-ZS sample shows a peak temperature (Tp) of 15.82° C higher than in the case of BWP sample, makes it more resistant to denaturation. The IWP sample has a Tp of 87.25 °C, so it contains proteins in higher quantity and is more resistant to distortion than the other two.
Wit and Klarenbeek (1981) [19,20] analyzed by DSC the thermal behavior of major whey protein to 150 °C and observed two distinct heat effects: up to 70 °C the effect is attributed to denaturation and near 130 °C is attributed to the denaturation of the remaining protein structure. Regarding to the second transition isotherm, after Wit and Fitzsimons [7, 18,19] this can be attributed over 100 °C, to β-Ig, and the breakdown of disulfide bonds, which have a very important role in stabilizing the spatial architecture of the protein molecule, followed by protein denaturation.
In Figure 7 we can see an isothermal transition in the case of the LZS sample having Tp of 144.23 °C and BWP sample with Tp of 126.94 °C. It is observed in the BWP sample a third isothermal transition to Tp of 147.3 °C which could be attributed to possible denaturation of other proteins unfolded yet. For a higher ratio of β-Ig / α-lg, the denaturation temperature increases and this increase is more pronounced when the overall protein concentration is lower, probably due to the lower amount of protein that is unfolding [5].
From a biological point of view, α-Ig is small protein, compact, has a more or less spherical shape and behaves like a coenzyme in lactose synthesis. The Ca ions are strongly bound and stabilize protein conformation.
Loss of Ca ions at an acidic pH leads to partial protein unfolded; in this case, even at a low temperature, irreversible degradation of the protein takes place. However, the β-Ig protein, the major serum protein, with properties that tend to dominate in particular the thermal treatment reactions. The β-Ig protein shows secondary and tertiary structures, having two -S-S bonds and a free sulfhydryl group. The tertiary or quaternary protein is subject to a series of changes depending on the pH or temperature changes [20].
Conclusions
Materials, reagents
The studied samples were three powders of Zonar lactoserum concentrate (L-ZS), bio whey protein concentrate (BWP) and whey protein isolate (IWP). All chemicals used were analytical-grade from commercial sources and used as received.
Equipments and sample preparation
ICP-OES analysis
A quantity of 5 grams of each studied sample were used to determine the concentration of mineral and trace element. Three parallel determinations of each sample were made. The sample crucibles were
introduced into a thermostated electric furnace, raising the temperature gradually from 50 °C to 50 °C (maintaining the temperature one hour on each level) to a temperature of 550 °C where it was maintained for 7 hours.
After the samples were removed from the oven, they were treated with a mixture of concentrated HNO3 (65%) and H2O2 (30%) in a ratio of 1:0.6, v/v successively added to each sample. After addition of HNO3, the sample
crucibles were placed on a sand bath to evaporate gradually. After cooling, H2O2 was added to the samples and heating was continued on the sand bath until the samples were again brought to dryness. The operation was
repeated two more times. Determination of mineral and trace element from the clear solutions, was done with the Optima 2100- Perkin Elmer inductively coupled plasma-optical emission spectrometer (ICP-OES) connected to a
computer.
HPLC analysis
Determination of the lactose content was performed by highperformance liquid chromatography (HPLC). Lactose was purchased from Aldrich (Milwaukee, USA). HPLC Sample preparation: 1 mL of milk-serum
sample was diluted with 4 mL water. To 1 mL of this diluted solution 4 mL of 70% of acetonitrile were added, leading to protein precipitation; the solution was passed through a 0.45 μm filter and injected in the HPLC system. A
HPLC Jasco Chromatograph (Japan) with a refractive index detector (RI) was employed. The data were processed with the ChromPass software. Separation was carried out on a CARBOSep column at 70ºC column
temperature. The mobile phase was a Milipore ultrapure water and the flow rate was 0.5 mL min-1 and the injector volume was 20 μL [21].
OPLC analysis
The acidic hydrolysis of the protein samples was performed in a hydrolysis tube: a protein mass of about 5-10 mg was treated with 1mL of 6M HCl, and heated at 110 ºC for 24 h. The acid-hydrolyzed solutions were
neutralized at pH 7 and then filtered on Munktell quantitative filter paper grade 389 (Munktell & Filtrak Gmbh, Barenstein, Germany).The filtrate of each sample was collected in a volumetric flask of 10 mL and brought to
volume with water. OPLC analysis was performed with the Personal OPLC 50 chromatograph (OPLC-NIT, Budapest, Hungary) on 20 cm × 20 cm. OPLC plates precoated with 5-μm particle silica gel F254 (LA001; OPLCNIT).
The standards and the samples were applied on the plate with micropipettes in quantities of 2 μL.
SEM analysis
For surfaces analysis of the samples an INSPECT S (FEI Co) microscope was used.
DSC analysis
Differential scanning calorimetry (DSC) was performed using a Mettler Toledo DSC 823e/700 °C. The measurements were carried out in the 25-200 °C temperature range, in aluminum crucibles, under nitrogen
flow (80 mL·min-1) with a heating rate of 10 °C ·min-1. The sample weight was in the range of 7 -13 mg. The variation of the heat flow transmitted through the sample relative to a reference (empty crucible) is recorded.
Acknowledgements
This work was funded by the Romanian Ministry of Education and Research, National projects: PNIII-P2-2.1-BG-2016-0204, 112 BG/2016; PNIII-P2-2.1-BG-2016-0335, 28BG/2016.
References
- K.J. Kimberlee Burrington, Dairy Research Institute,Technical Report: “Whey Protein Heat Stability”.
- N. Erdogdu, Z. Czuchajowska, Y. Pomeranz, Cereal chemistry, 1995, 72(1), 70.
- III-Dairy-G-Whey Products-5, https://nzic.org.nz/ChemProcesses/dairy/3G.pdf
- H. Patel, S. Patel, “Technical Report: Understanding the Role of Dairy Proteins in Ingredient and Product Performance”, USA Dairy Export Council, Edited by Robert Beausire, 2015.
- T. Vieira Arriaga, “Controlled and tailored denaturation and aggregation of whey proteins, dissertation”, Technical University of Lisbon, 2011.
- https://www.malvernpanalytical.com/en/products/technology/microcalorimetry/differential-scanning-calorimetry
- S.M. Fitzsimons, D.M. Mulvihill, E.R. Morris, Food Hydrocolloids, 2007, 21(4), 638.
- M.S. Da Silva, C. Bigo, O. Barbier, I. Rudkowska, Nutrition Research, 2017, 38, 43.
- R.R. Wolfe, Journal of the International Society of Sports Nutrition, 2017, 14, 30.
- A.B. Nongonierma, R. J. FitzGerald, Peptides, 2015, 73, 20.
- https://zonar.ro
- P. Walstra, J.T.M. Wouters, T.J. Geurts, “Dairy Science and Technology” Second Edition, Taylor & Francis Group, LLC, 2006.
- M.W. Sawyer, Controlling the Mineral Content of Sweet Whey Powder in an Industrial Setting A Senior Project presented to the Faculty of the DairyScience Department California Polytechnic State University, San Luis Obispo In Partial Fulfillment of the Requirements for the Degree Bachelor of Science, 2010.
- Imre Mucsi, Nutrients in whey and nutritional Properties of whey in Whey Every Aspect, Whey Handbook For The Dairy Sector, Edited by Kemal Çelik, pg. 69-90.
- M.A. Haque, P. Aldred, J. Chen, C.J. Barrow, B. Adhikari, Food chemistry, 2013, 141(2), 702-711.
- M. Vlassa, V. Coman, M. Filip, F. Copaciu, A. Mocanu, M. Tomoaia-Cotișel, Journal of Planar Chromatography, 2013, 26, 165-171.
- https://www.malvernpanalytical.com/en/products/technology/microcalorimetry/differential-scanning-calorimetry
- J.N. de Wit, Neth. Milk Dairy Journal, 1981, 35, 47.
- J.N. de Wit, Klarenbeek, G. Journal of Dairy Research, 1981, 48, 293.
- P. Walstra, J.T.M. Wouters, T.J. Geurts “Dairy Science and Technology - Second Edition”, Taylor & Francis Group, LLC, 2006.
- D. Prodan, M. Moldovan, I. Perhaita, M. Filip, C. Sarosi, M. Vlassa, L. Silaghi-Dumitrescu, Physicochemical Characterization of Four “ZONAR” WHEY Samples, International UAB - BENA Conference Environmental Engineering and Sustainable Development, 25-27 mai, 2017, Alba Iulia, Romania.